When the Tilt-Up Market Index (TUX) was introduced in 2025, the objective was to provide a timely and member-driven signal of business conditions across the tilt-up industry. It was not designed to replace existing measures or the lived experience of those working in the field. It was intended to sit alongside them—offering a consistent view of activity and sentiment as they evolve.
One year later, the value of the Index is not found in any single quarter. It is found in what becomes visible when those quarters are viewed together.
Across four consecutive reports, the tilt-up market does not present as a single, unified condition. It expands, pauses, and reaccelerates, but not always in alignment with sentiment, not evenly across regions, and not consistently across project types.
This is not a contradiction. It is a clearer representation of how the market actually moves.
Timing, Not Just Direction
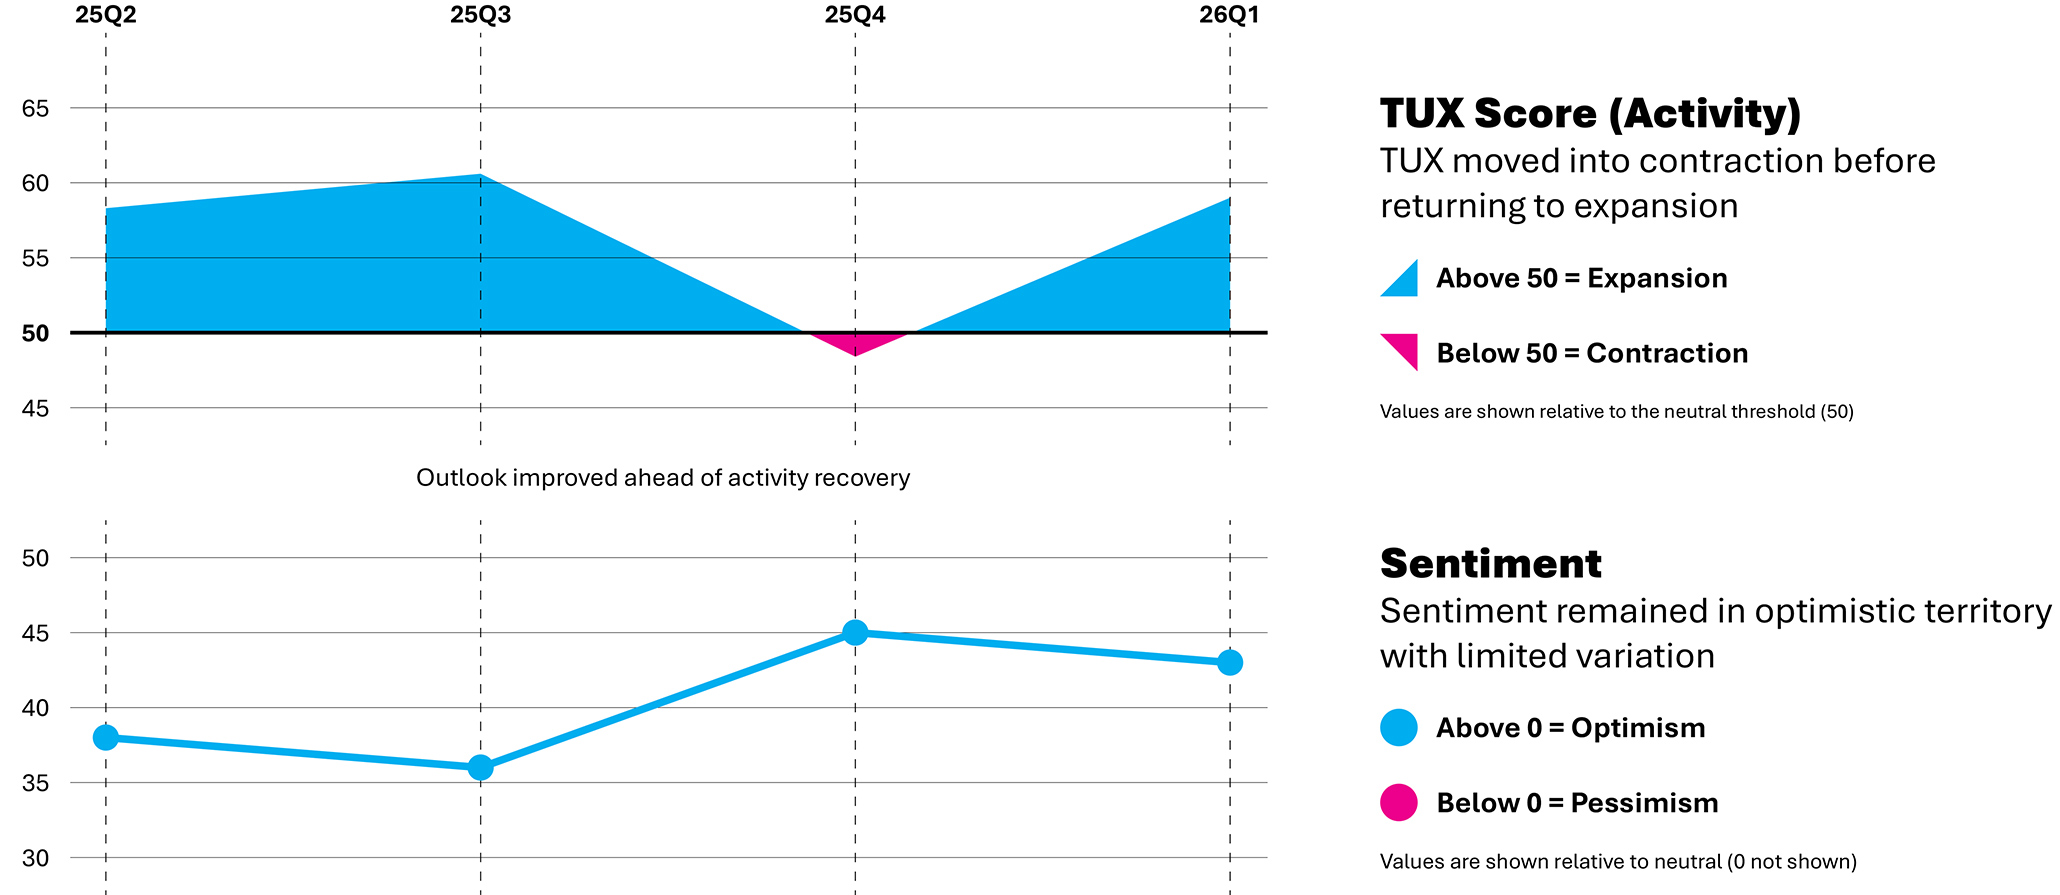
The most instructive insight from the first year is the relationship between current activity and forward-looking sentiment.
Through mid-2025, the Index reflected steady expansion. Conditions strengthened slightly into the third quarter, suggesting a market settling into equilibrium. By the fourth quarter, reported activity declined below the neutral threshold, even as sentiment improved and confidence in the near-term outlook increased.
Advisory commentary during this period consistently pointed to a similar condition: Projects remained active, but they were moving more slowly through financing, approvals, and award cycles. The slowdown was not driven by a lack of opportunity but by delayed execution.
By the first quarter of 2026, activity returned to expansion.
Viewed together, these movements suggest a sequence: Confidence stabilizes, activity lags, and then activity returns. The market signals recovery before it fully reflects it.
A Market Without a Single Center
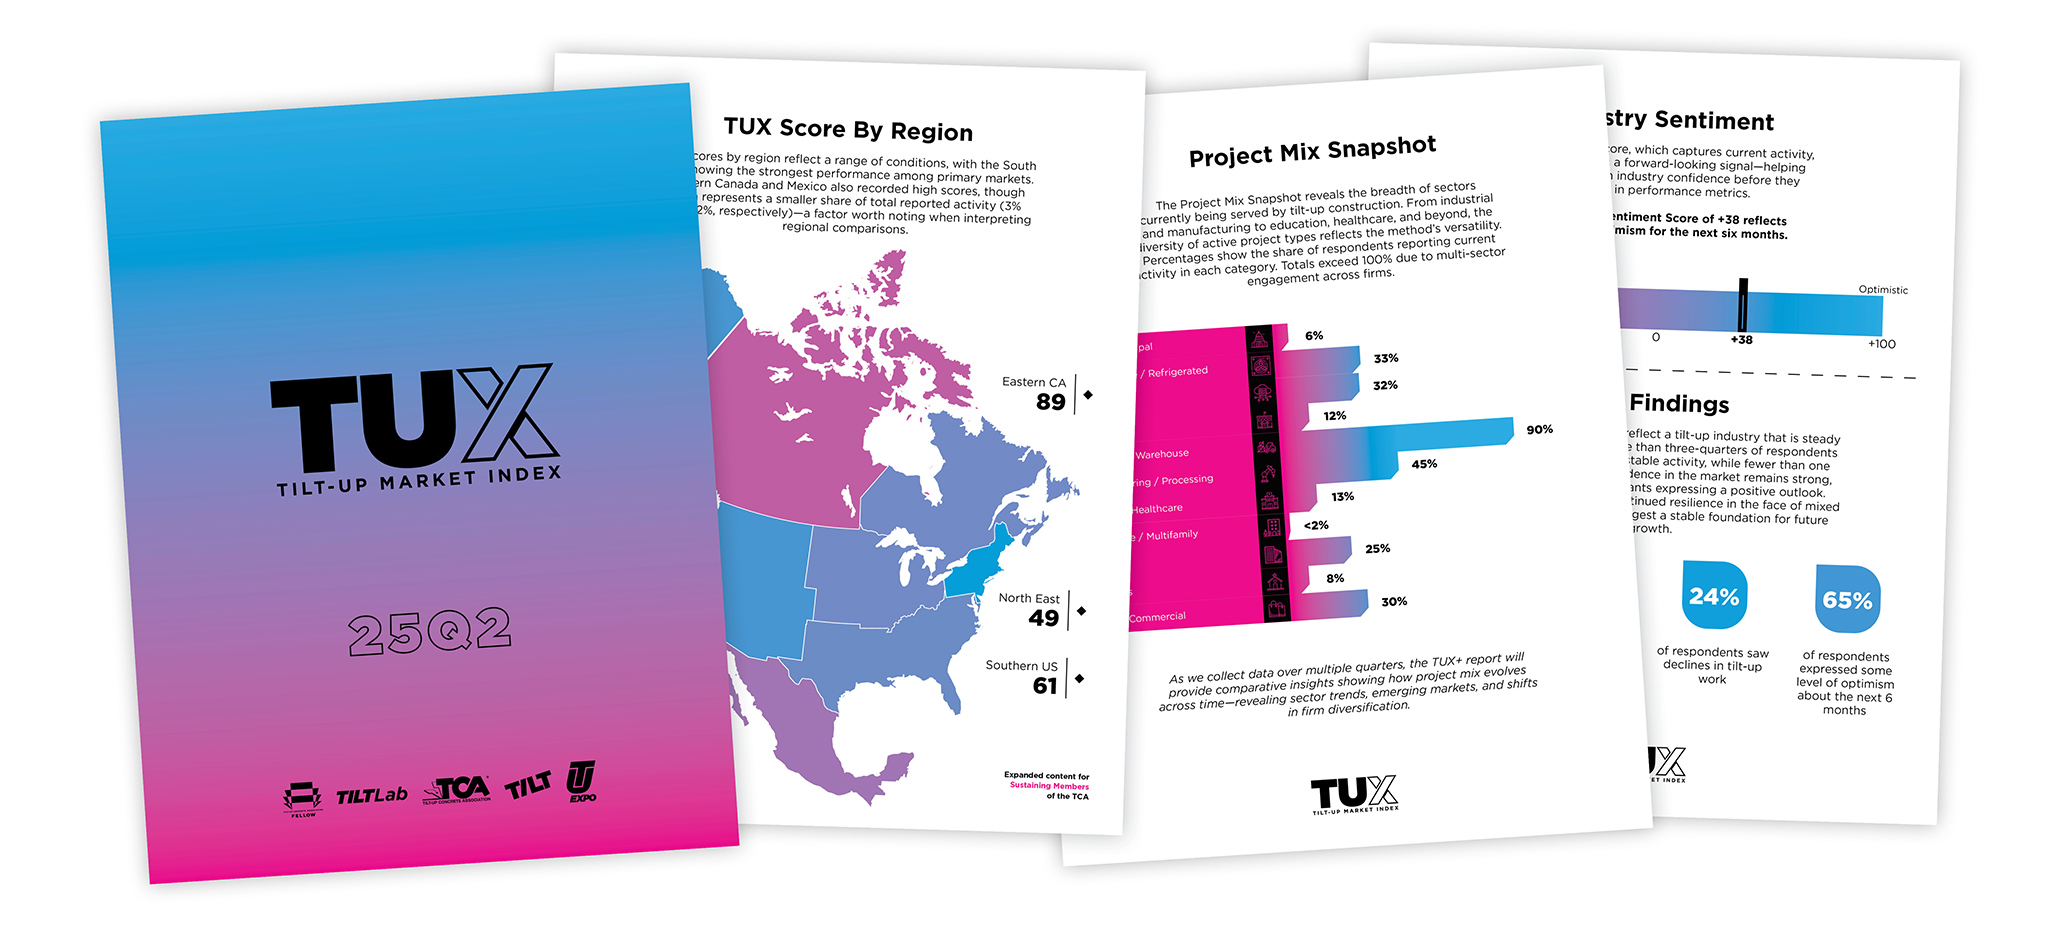
Regional data throughout the year reinforces a second point: The tilt-up market does not operate as a single system.
The southern United States consistently represents the largest share of reported activity, yet it does not always lead in momentum. Western markets show periods of relative strength followed by periods of moderation and renewed growth. Smaller regions exhibit more pronounced variability because they are influenced by both scale and localized conditions.
These differences are not anomalies. They are structural.
The Index does not attempt to resolve them into a single narrative. It allows them to remain visible, providing a more accurate view of how demand and activity are distributed across the industry.
Stability Beneath Variation
While activity levels and regional conditions shift, the composition of work shows greater continuity.
Industrial and warehouse construction remains the dominant project type across all four quarters, reinforcing tilt-up’s established role in logistics and distribution. At the same time, incremental changes are evident. Data centers maintain a strong presence. Education increases its share. Manufacturing softens from earlier levels, while office and retail activity persist in more targeted applications.
These shifts do not redefine the market. They indicate a gradual broadening of it.
What Can Be Observed—and What Cannot Yet Be Concluded
With four quarters of data, the Index is beginning to establish relationships but does not yet demonstrate long-term patterns.
Seasonality, for example, remains undefined. The fourth-quarter slowdown may reflect broader economic conditions, typical year-end dynamics, or a combination of both. At this stage, it is not possible to distinguish between them with confidence.
Similarly, as participation continues to expand and stabilize, the clarity of the Index will improve.
For these reasons, the first year should be understood as a starting point for observation rather than a definitive statement regarding trends.
Using the Index
The practical value of the TUX is not in prediction, but in orientation.
It provides context for interpreting conditions that firms are already experiencing—whether that is distinguishing between delayed projects and reduced demand, understanding how regional momentum is shifting, or recognizing how sentiment and activity are moving relative to one another.
For firms engaged in business development, it offers a broader frame for timing conversations and evaluating opportunities. For those managing operations, it supports a more informed interpretation of pipeline conditions. For leadership, it provides a shared reference point that extends beyond individual markets or perspectives.
In each case, the Index does not replace judgment. It adds structure to it.
A Shared Record
Construction markets are often understood retrospectively as they are shaped by data that arrives after conditions have already changed. The Tilt-Up Market Index introduces a different approach: a continuous, member-driven record of conditions as they are experienced.
Over time, this record will allow patterns to emerge—including relationships between sentiment and activity, regional cycles, and shifts in project mix that can be compared across years rather than recalled from memory.
The first year does not define those patterns.
It establishes the ability to see them.
By The Tilt-Up Concrete Association
Be the first to comment